

Edmonton Rental Market Report: September 2026
Oct 2nd, 2026
Edmonton’s average asking rent for an unfurnished one-bedroom rental was $1,254 in September 2026, down 0.75% from August, according to
liv.rent
’s report. Furnished one-bedroom rentals averaged $1,398, down 1.03%.
For landlords, the more useful detail is how prices differed across Edmonton. Unfurnished one-bedroom sector averages ranged from $1,183 in Northeast Edmonton to $1,345 in Southwest Edmonton. Those differences help explain why pricing a rental requires more than a citywide average.
This Edmonton rental market report breaks down September’s figures by location, bedroom count and furnishing, then explains how owners can use them to review their rental’s competitive position.
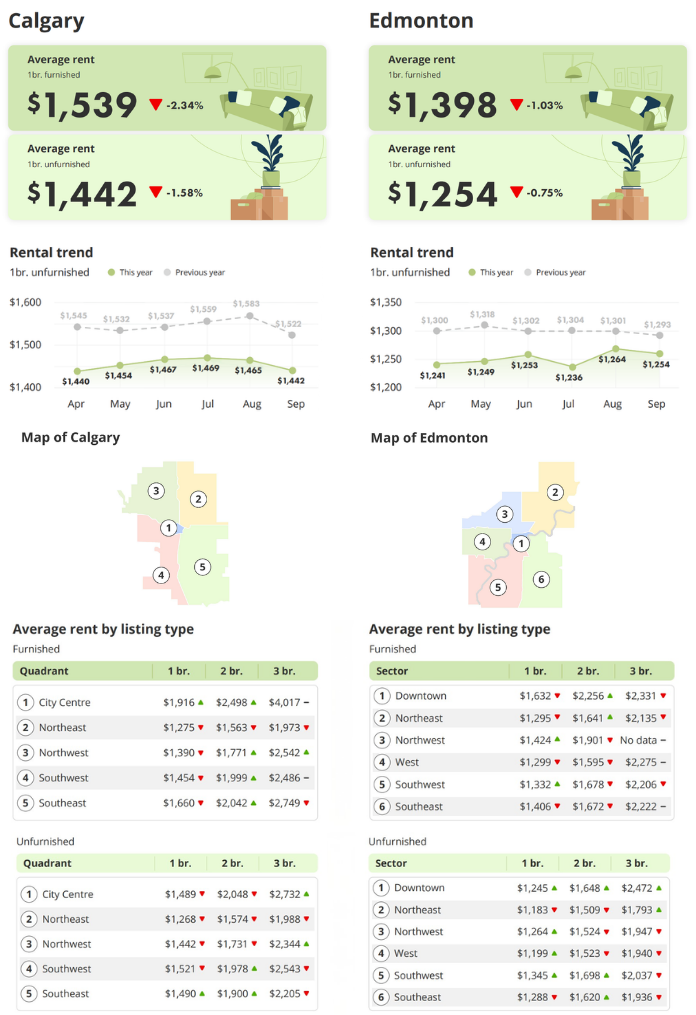
Source: liv.rent, September 2026 Calgary and Edmonton rental report. All rental figures in this article come from this report.
What Was the Average Rent in Edmonton in September 2026?
One-bedroom rental type | Average monthly asking rent | Reported change from August |
Unfurnished | $1,254 | −0.75% |
Furnished | $1,398 | −1.03% |
The furnished average was $144 higher per month than the unfurnished average.
Calgary’s corresponding averages were $1,442 for unfurnished and $1,539 for furnished one-bedroom rentals. Edmonton was $188 lower for unfurnished units and $141 lower for furnished units.
These figures are asking-rent benchmarks, not guaranteed lease rates or an average covering every property type. Each category represents a different group of listings, so differences between averages are not comparisons of identical homes.
How Did Edmonton One-Bedroom Rents Change in September?
September’s unfurnished one-bedroom average eased from August, but remained within the narrow range shown throughout spring and summer.
Month | 2026 average | Previous-year average |
April | $1,241 | $1,300 |
May | $1,249 | $1,318 |
June | $1,253 | $1,302 |
July | $1,236 | $1,304 |
August | $1,264 | $1,301 |
September | $1,254 | $1,293 |
September was $10 below August and $39 below September of the previous year, approximately 3.0% lower based on the displayed figures.
The six-month range was just $28. That shows relatively modest movement in this particular rental category.
For a comparison with the preceding month, read our
August Edmonton rental market update.
The report does not establish why averages changed or how quickly properties leased. Changes in the mix of advertised homes can also affect an average.
Average Unfurnished Edmonton Rent by Sector and Bedroom Count
September’s sector figures show why landlords need to look beyond the citywide number.
Edmonton sector | 1 bedroom | 2 bedrooms | 3 bedrooms |
Downtown | $1,245 | $1,648 | $2,472 |
Northeast | $1,183 | $1,509 | $1,793 |
Northwest | $1,264 | $1,524 | $1,947 |
West | $1,199 | $1,523 | $1,940 |
Southwest | $1,345 | $1,698 | $2,037 |
Southeast | $1,288 | $1,620 | $1,936 |
Southwest Edmonton had the highest unfurnished one-bedroom average at $1,345, while Northeast Edmonton had the lowest at $1,183. The difference was $162 per month.
Southwest also had the highest two-bedroom average at $1,698. Downtown led the three-bedroom category at $2,472.
A renovated condo with parking and in-suite laundry may compete with a different set of listings than an older apartment nearby. Compare property type, size, condition and inclusions before deciding where your rental belongs.
How Do Furnished Rental Prices Compare Across Edmonton?
Edmonton sector | 1 bedroom | 2 bedrooms | 3 bedrooms |
Downtown | $1,632 | $2,256 | $2,331 |
Northeast | $1,295 | $1,641 | $2,135 |
Northwest | $1,424 | $1,901 | No data |
West | $1,299 |